Tweet Miner: Collecting, Storing and Visualizing Real Time Twitter Data in Various Graphical Format
Project Details
| Client: | Acumen Analytica - Big Data and Social Analytics company in Riyadh, Saudi Arabia |
| Pricing: | Fixed Pricing |
| Duration: | 40 Days + 3 Months of support |
| Staff: | A Team Lead 1 Senior Developer and 1 Junior Developer |
| Technologies: | Python 3x, Django, Celery, Javascript, Redis, Elasticsearch 7x, MongoDB, Mongo-Connector, Google Compute Engine, UI/UX Design, RStudio, Twitter API, NLTK, HighCharts, Google Maps, D3 charts, Leaflet Maps, amCharts |
| Services: | NLP, AI, ML, Deep Learning |
BACKGROUND
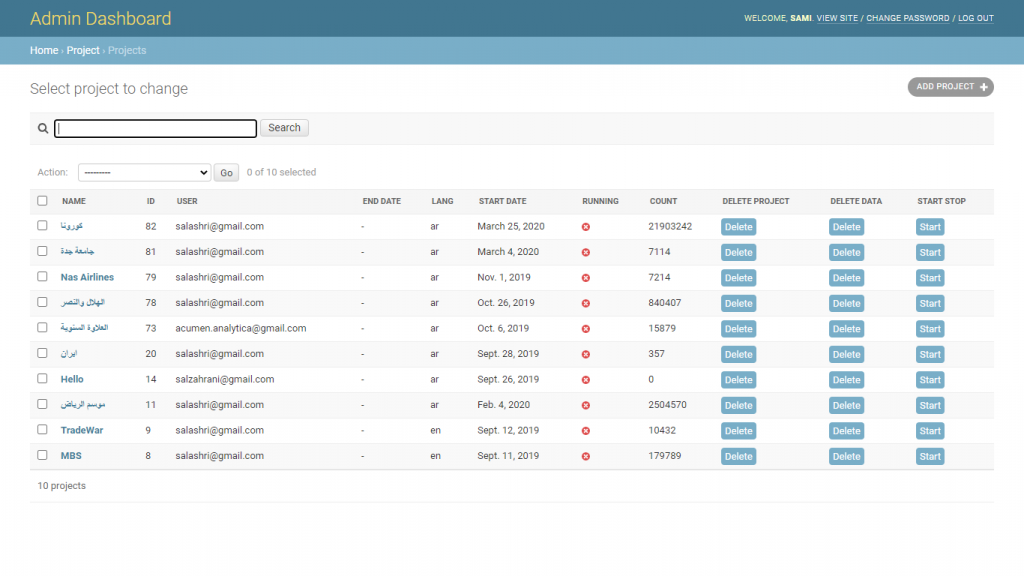
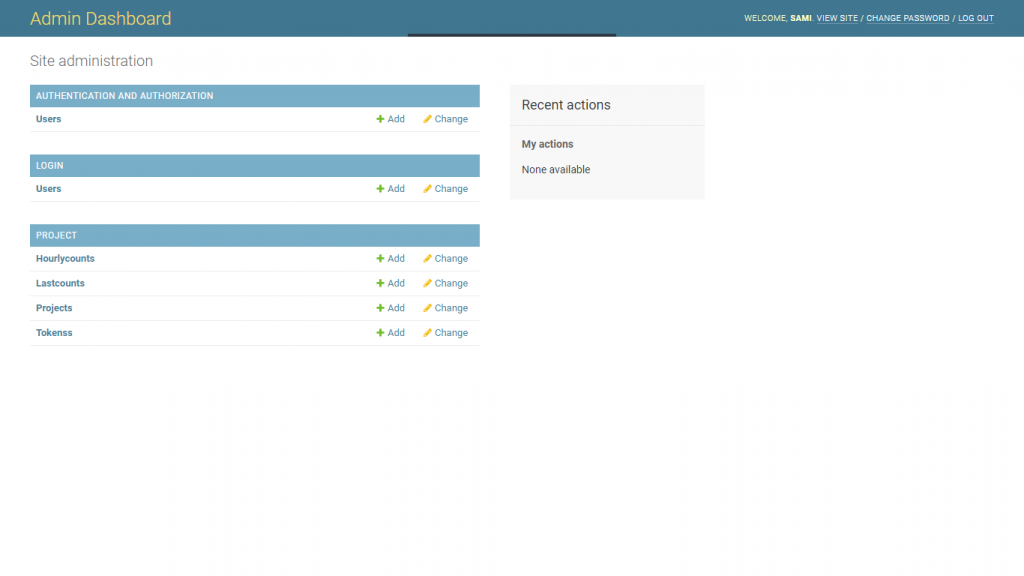
The executives at Acumen Analytica contacted and tasked us with designing and developing a web application that can mine twitter data. The main functionalities of the web application included a Login/Register page with email and captcha verification, a user interface that will control different components of a project and an interface that will visualize all the collected data of a project in various graphical formats (network graph, bar graph, timeline graph, pie chart and word cloud). An admin panel through which they can maintain the users registered to the application, add new Twitter API tokens and also be able to monitor functioning of the tokens. The admin panel can also control the data of the projects created by each user. Since the duration of the project was somewhat less, hence, we decided to appoint three resources full time; 1 Senior developer for backend, 1 junior developer for frontend and 1 team lead.
DESCRIPTION
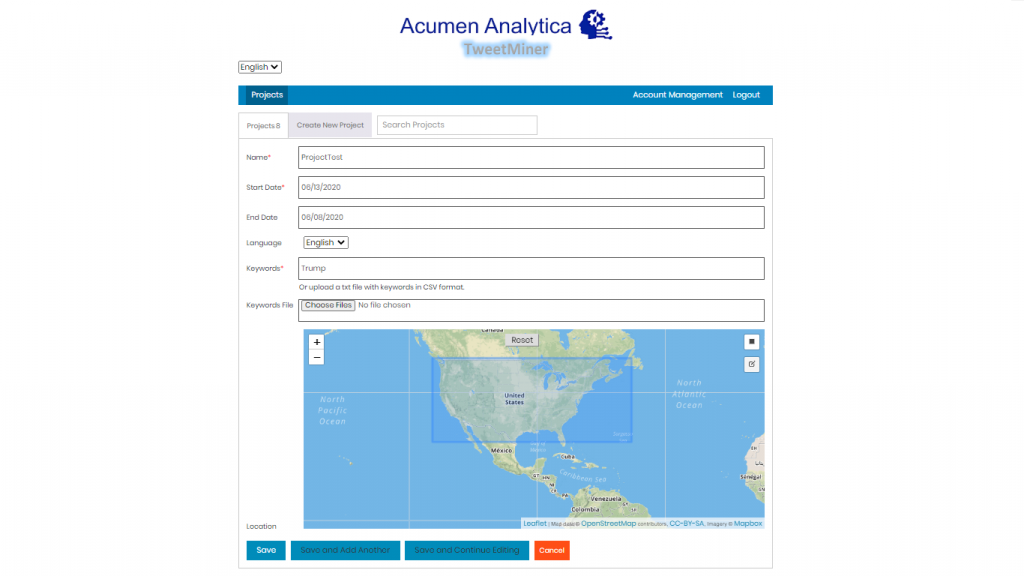
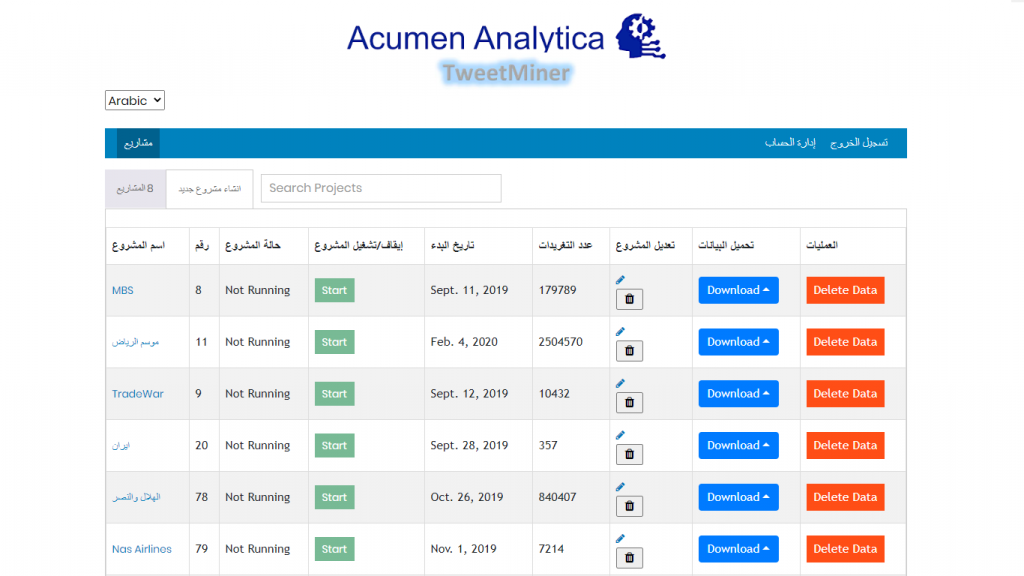
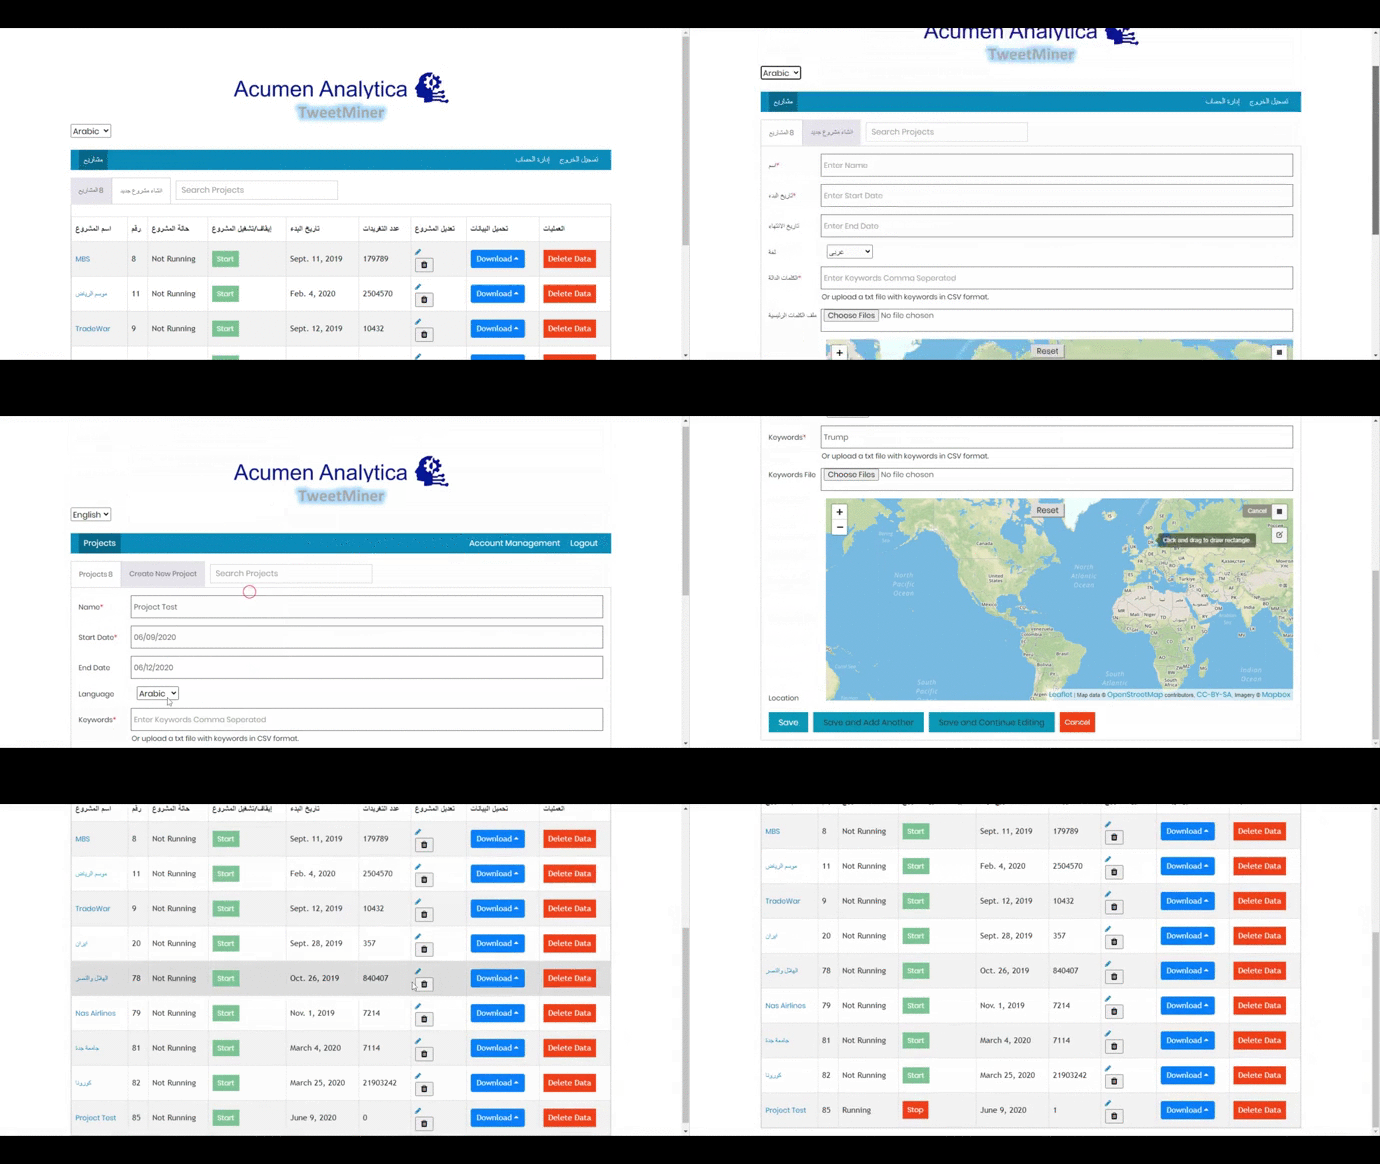
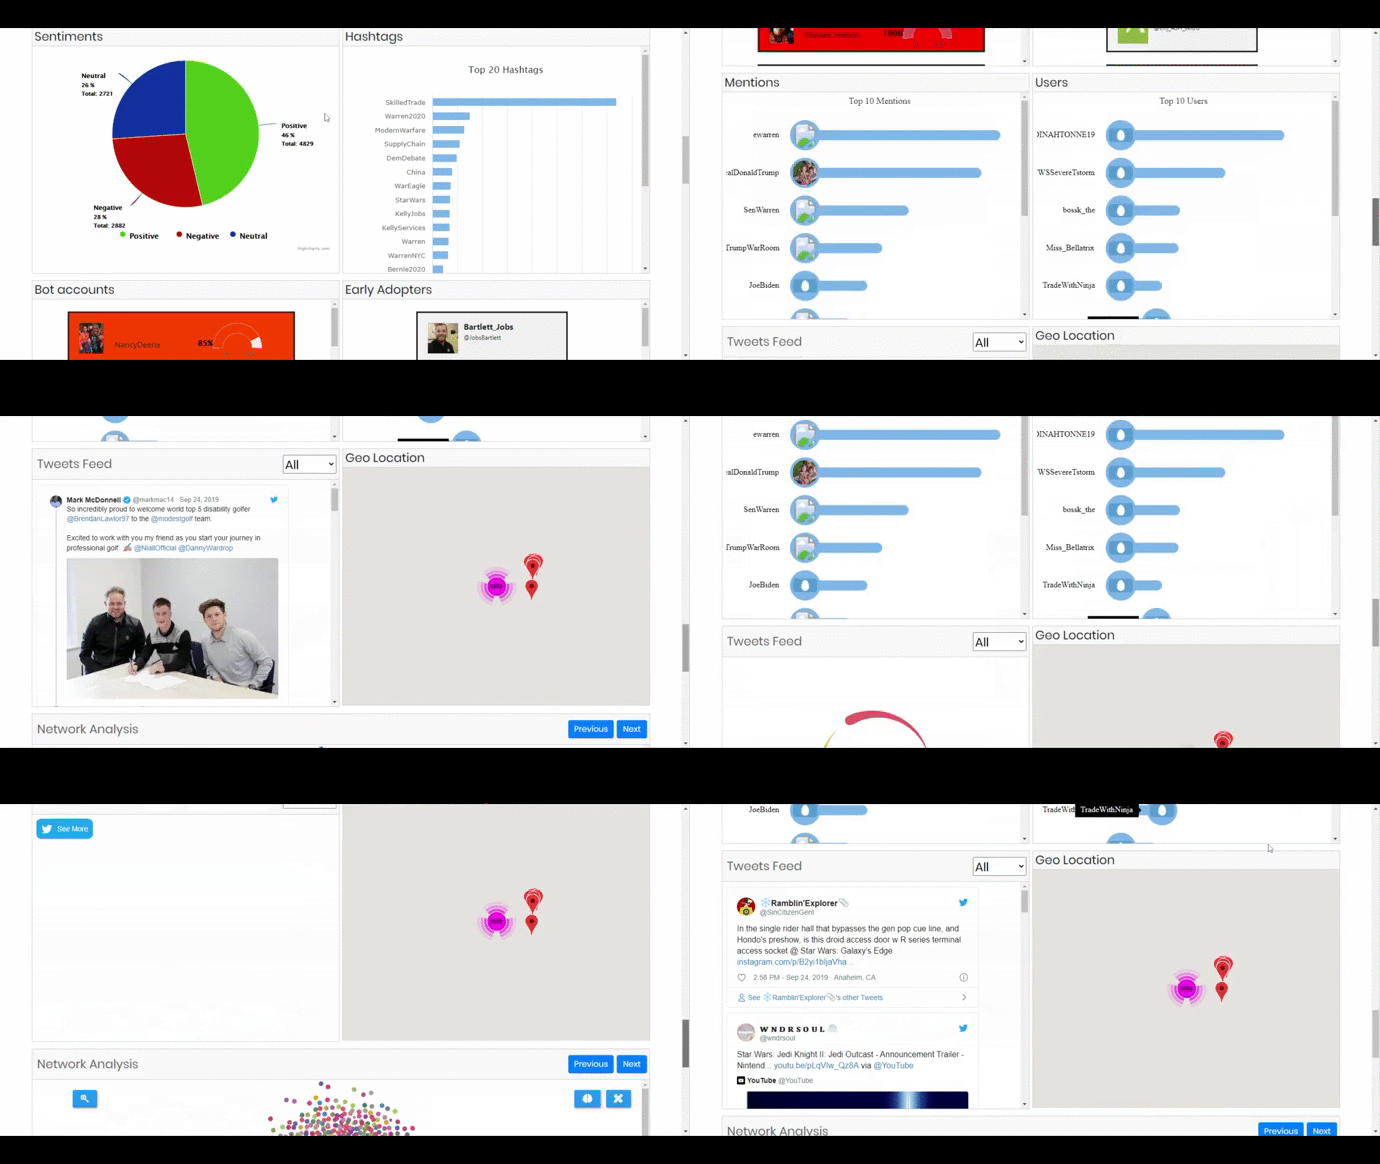
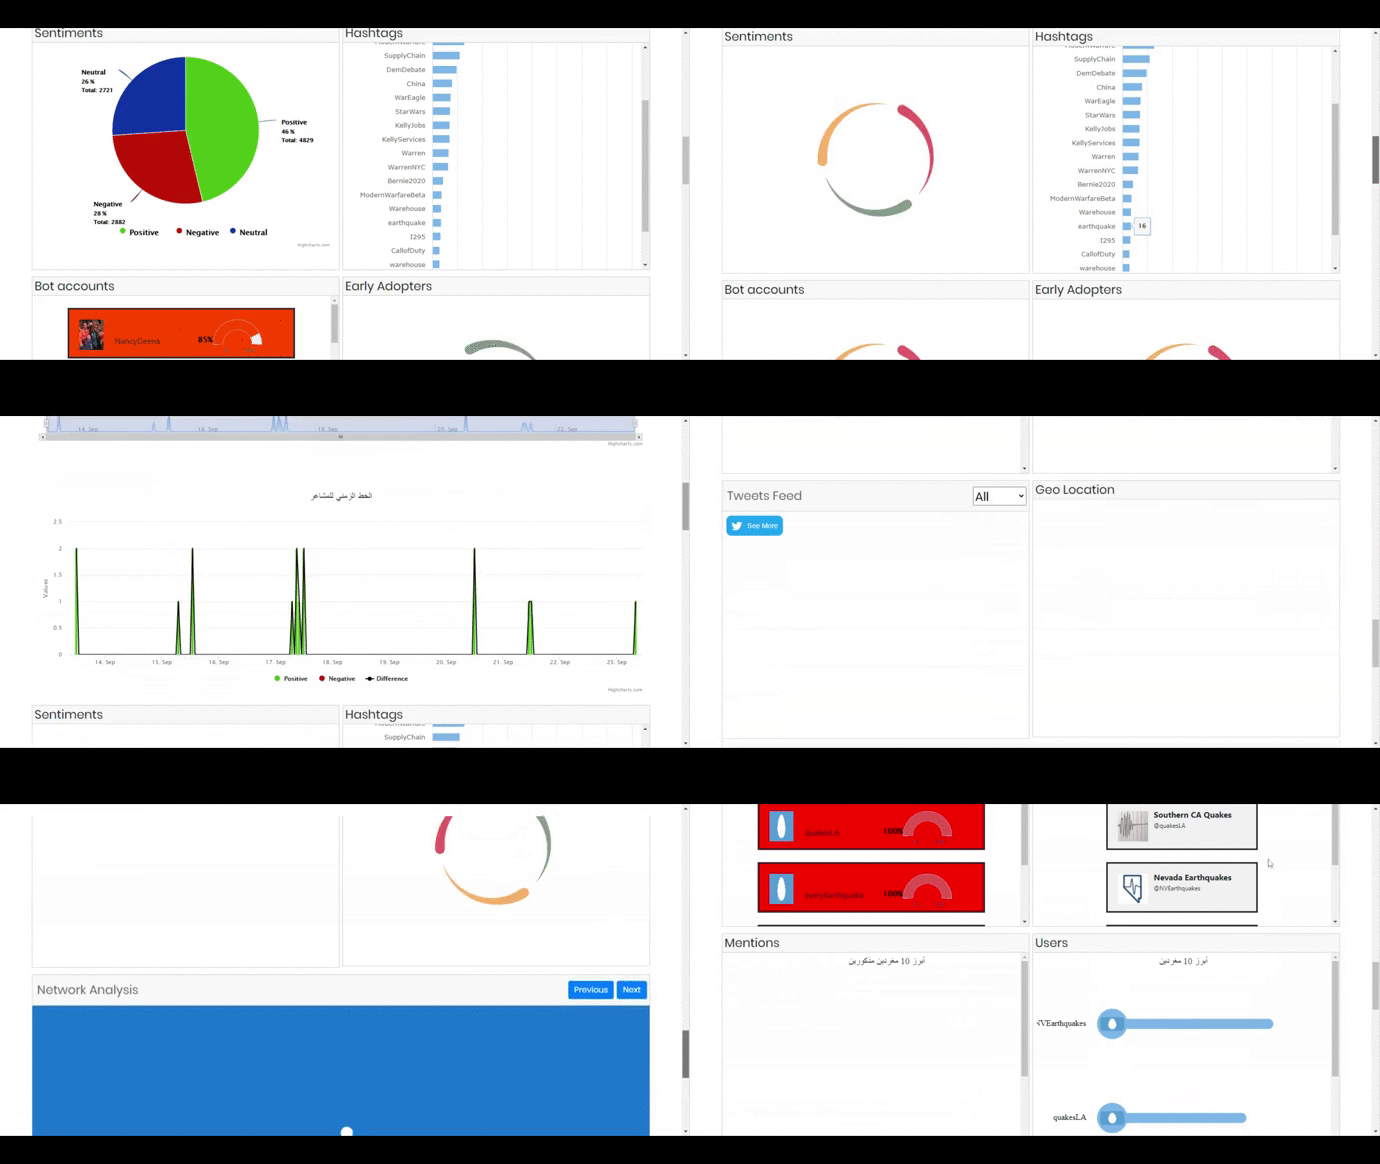
The web application allows users to collect data from twitter based on a list of keywords and also on the basis of location (if specified). The Twitter API’s standard tokens allow to stream real time data and can also collect past 7 days data based on keywords and location. The tokens were provided by the client. The users using this tool must first be registered to the application through a Register page which will have a captcha verification and also an email verification step in order to stop fake users or bots to register to the application. The Login page will also have a captcha verification. The users must also be verified by the admin. Hence an admin panel is also created to monitor and maintain the registered users. The admin panel will also control the number of tokens and monitor their functioning. In order to monitor their functioning; number of tweets collected by a token in the last 24 hours, number of projects using this token and the last error occurred by the token is displayed on the admin panel. The data of projects created by each user and the functioning of a project (creating, starting, stopping, deleting) can be controlled by the admin. A registered user when logged-in can see the number of projects created by it along with their information (name, start-date, number of tweets collected, id) and can control their operations. The operations of a project include creating, starting, stopping, deleting (data or project), editing (keywords, location, name) and downloading data to JSON/CSV. An account management page is also placed if the user wants to change its information. A project can be created by providing a keyword or a list of keywords, language (English, Arabic, Turkish or Persian), start date and location. The constraint of location is not compulsory. The location will be specified on a map. The application will have a language option to display the tool in either English or Arabic. The main part of the application is visualization of the project data. The following components are present in the visualization part.
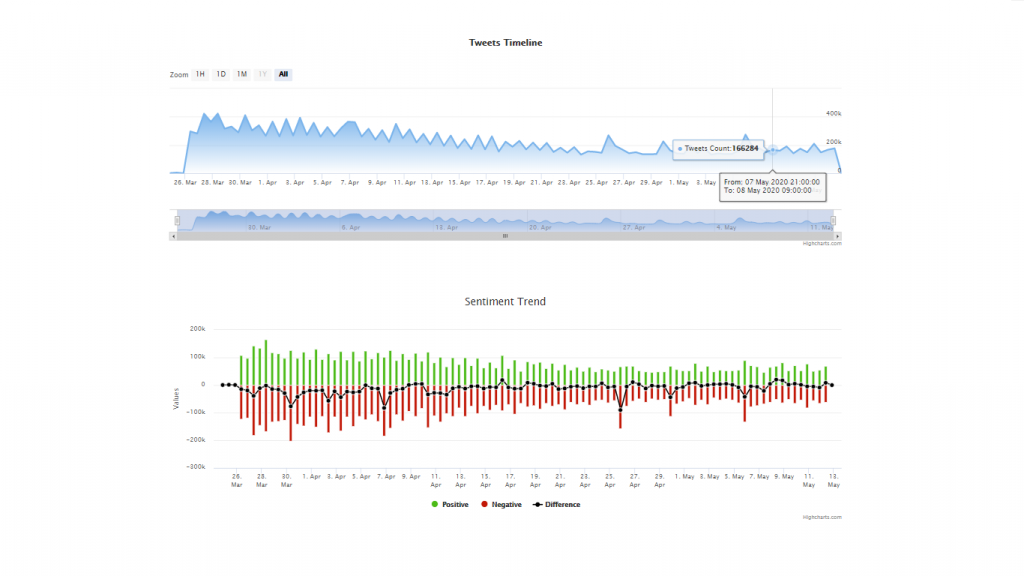
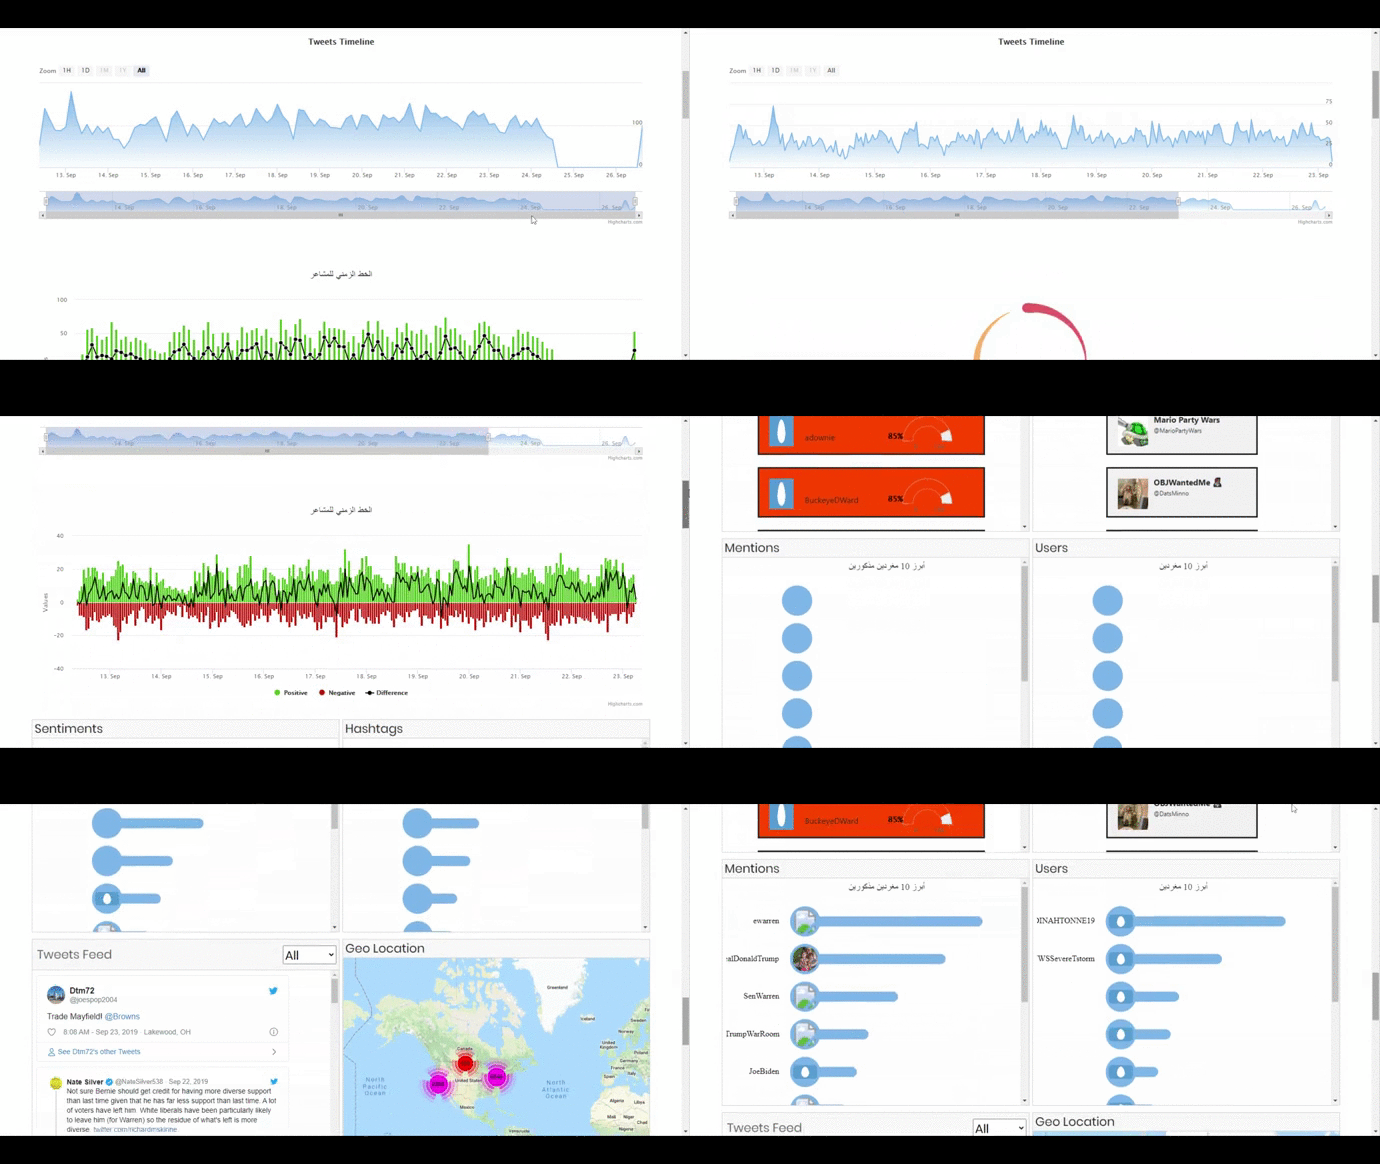
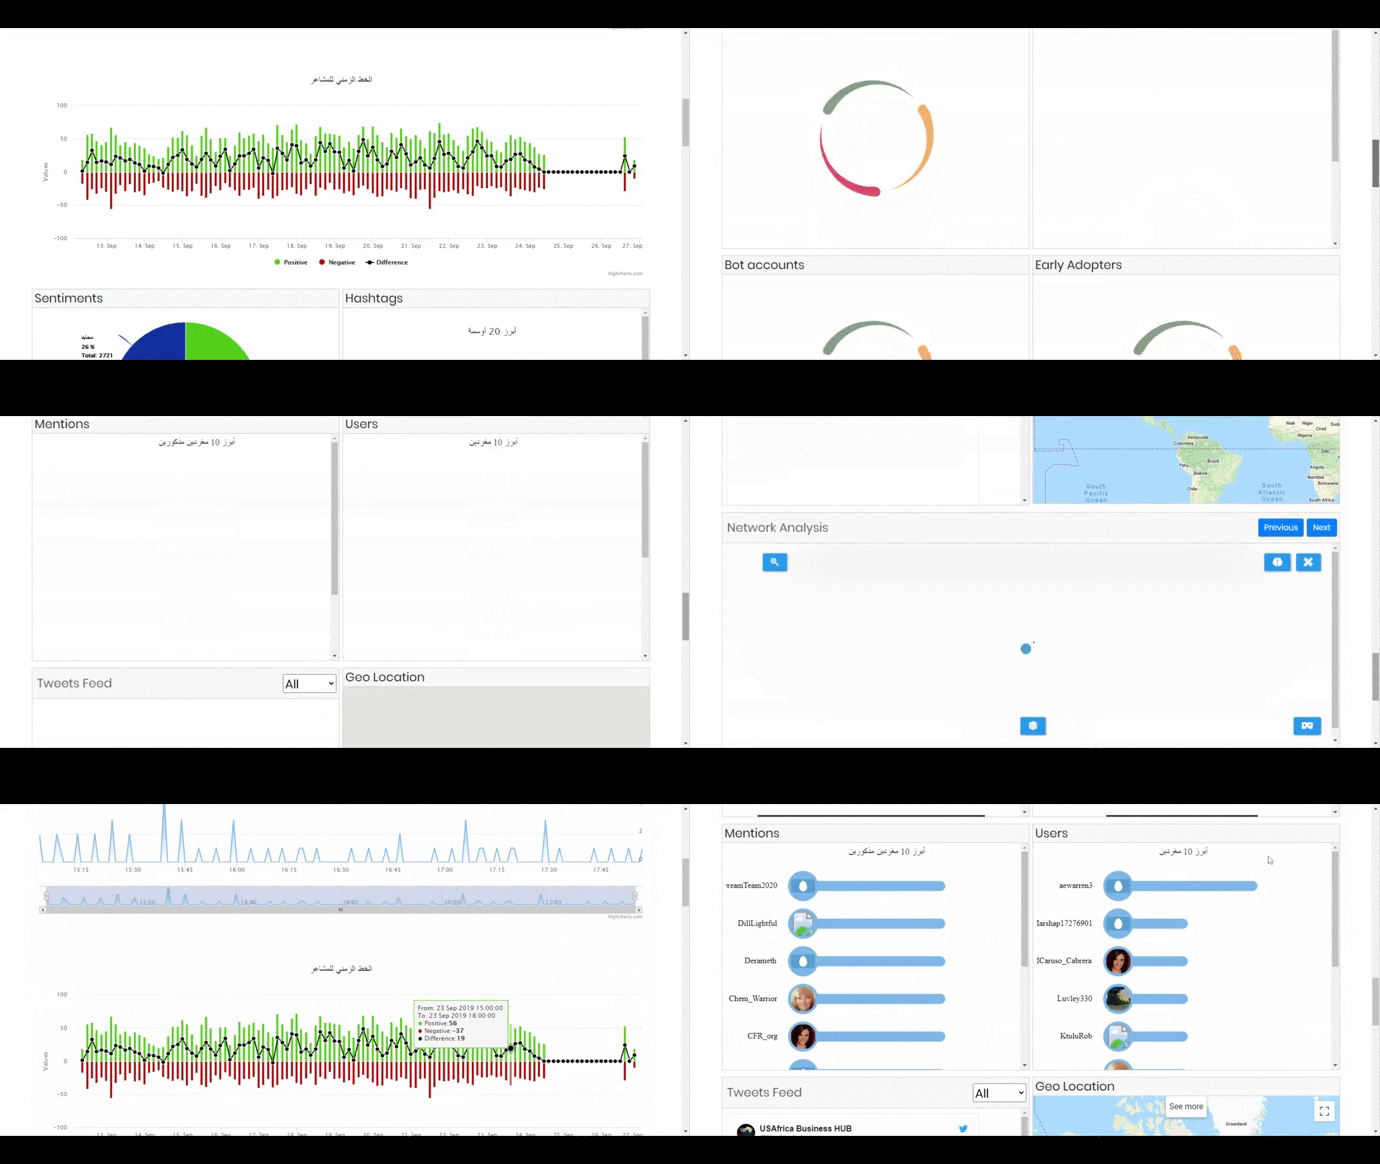
- Time Series Graph which will display the frequency of tweets collected against time of creation. All data shown in the tool will be according to the window chosen in this graph.
- Sentiment Trend Graph showing the frequency of sentiments(positive, negative and neutral) against time.
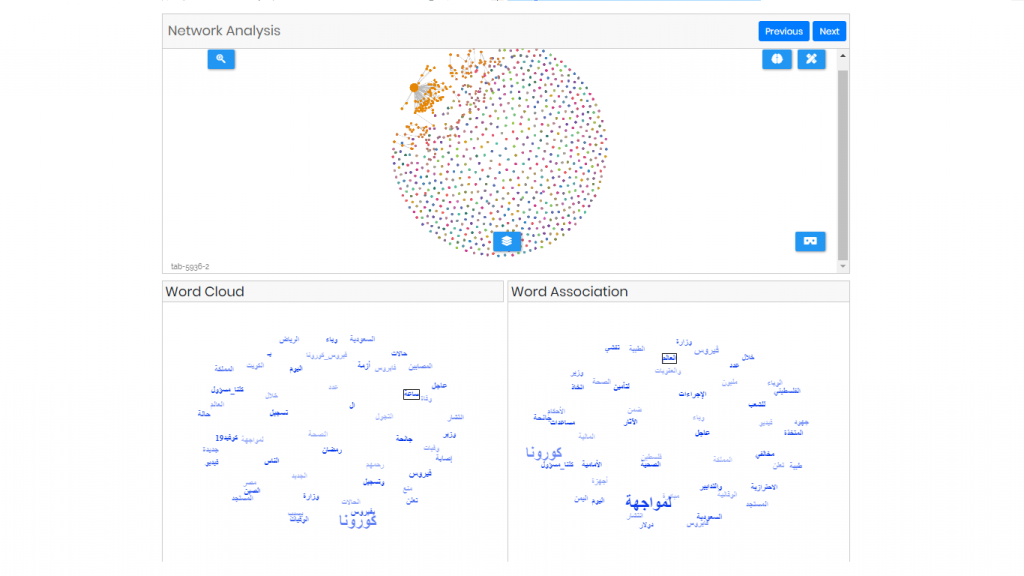
- A Network Graph which will show the relationship of different tweets with each other and on clicking a node the tweet will be displayed.
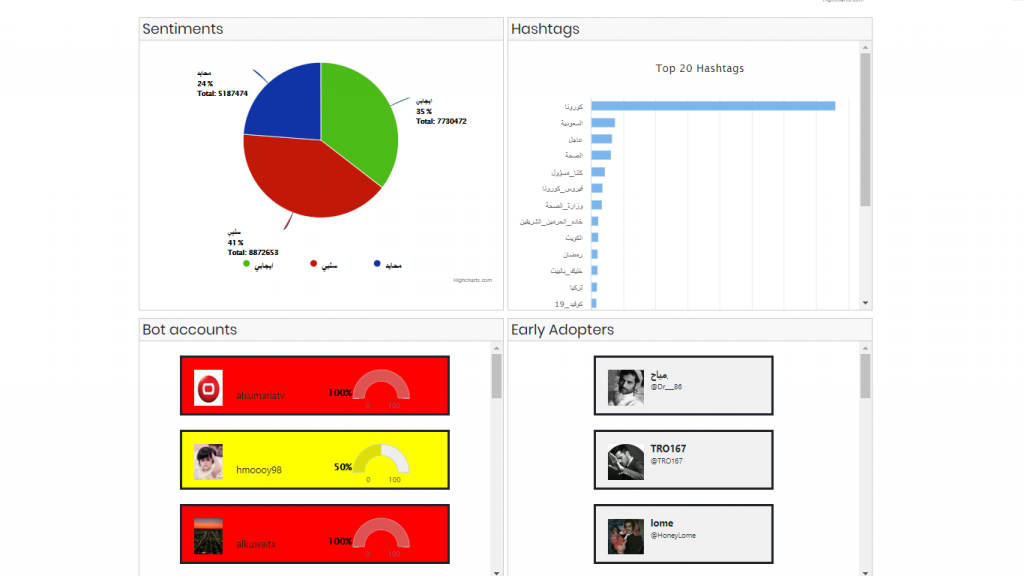
- Early Adopters – showing the users in the ascending order of their tweet creation date.
- Bot Accounts – which will detect the probability of an account being a bot. On clicking an account, the user twitter page will be open in the next tab.
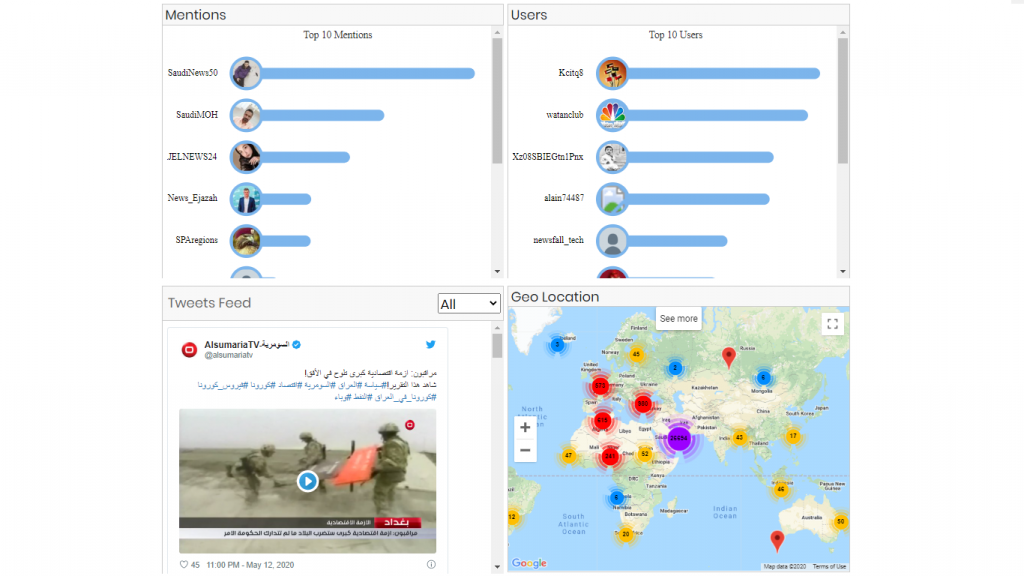
- World Map – Showing the location of different tweets on the world map.
- 3 Bar Graphs showing top 20 Hashtags, Mentions and Users. On clicking a bar, the visualization will show the related information in all the components and also open the tweet or user account on the next tab.
- Tweets Feed with options to select its type (Pictures, Videos, Links). On clicking a tweet, a user can reply to, like it or comment on it.
- Interactive Sentiment Analysis Pie chart that will also show related information on all the components when clicked.
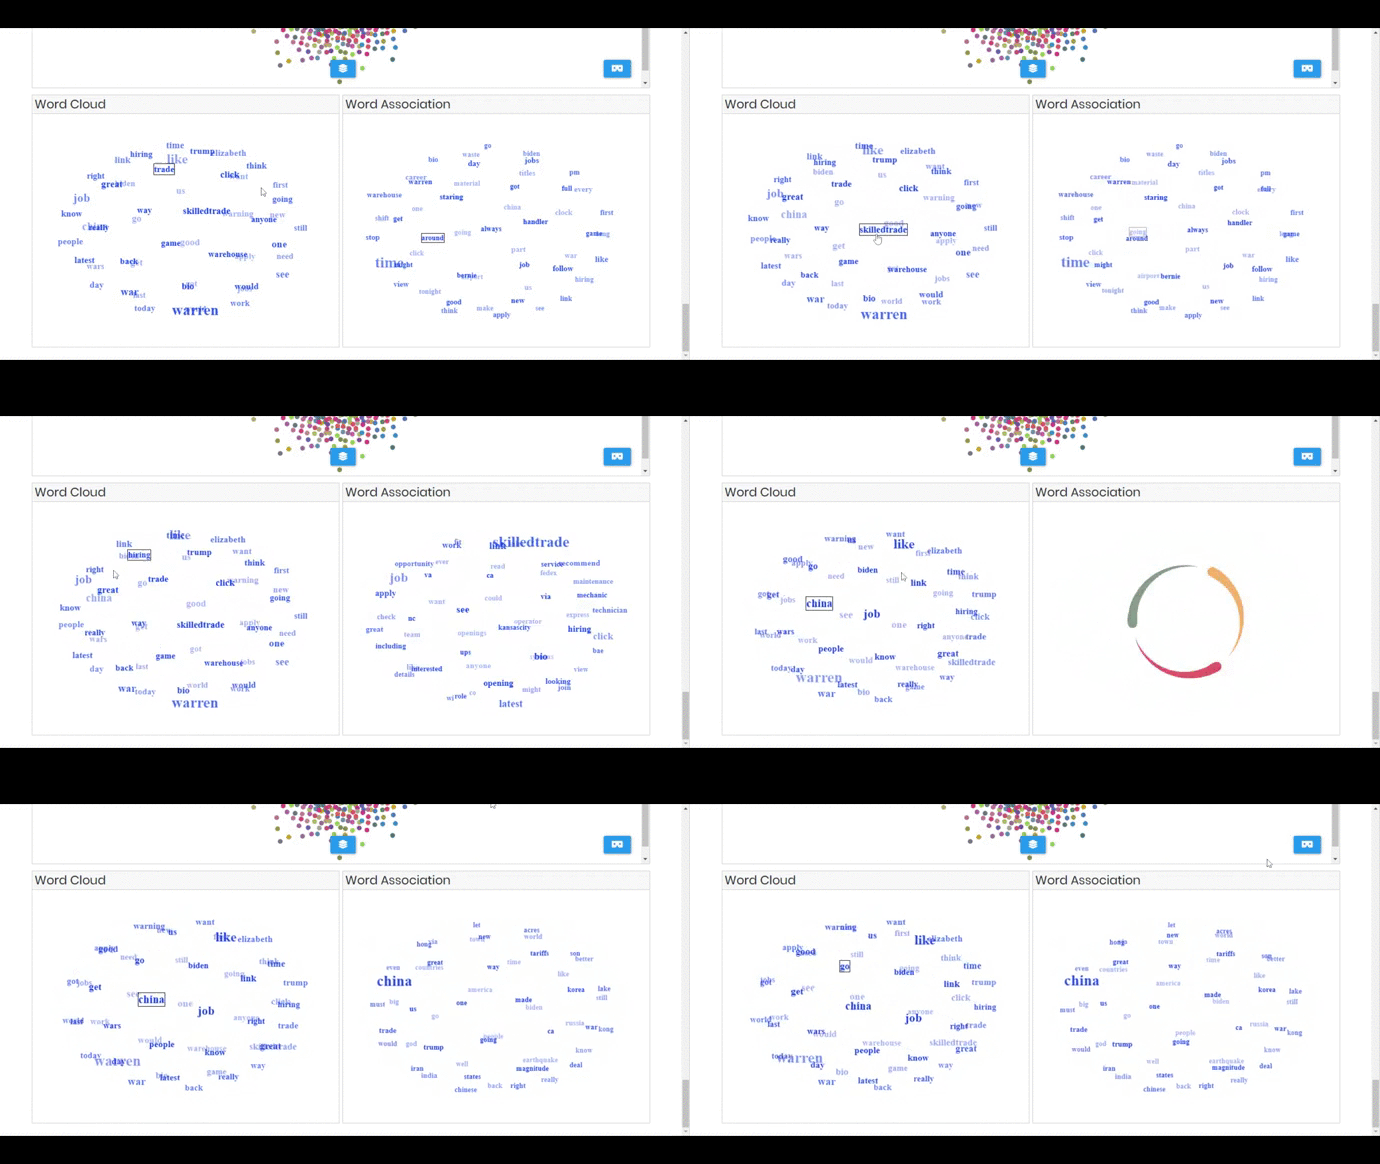
- Interactive Word Cloud of 2 and 3 grams, the visualization spins around and user can click on phrase and the related terms appear in the word association component.
- Words Association component (spins around too) that shows co-occurred terms for the selected phrase from world cloud (initially it’s empty)
- A search bar which will perform a text search on the hashtags, mentions and tweets stored for the project.
CHALLENGES
During the course of the project various challenges were faced but owing to the skillfulness of our staff and continuous cooperation with the client’s representatives these challenges were tackled and solved in an effective and satisfactory manner. Many minor challenges like choice of server, framework, frontend design etc. were faced but following were the main challenges:
- Selection of a database was a big hurdle. Since the the project will be streaming tweets over a long period, hence, a large number of tweets will be stored in the database. From these tweets the related information will be extracted via queries when the user will be visualizing the project. A database that can handle big data was favorable. Initially MongoDB was selected for this purpose because of its robustness and security. After completion of the application when over 10 millions tweets were collected for a project, the user experience became incredibly slow and posed an even bigger problem. The database on the server also periodically crashed and the tool became almost non usable.
- The standard tokens for the Twitter API can run at most simultaneously 2 projects. A project will need 1 whole token initially because it will stream not only real time data but will also collect past data (stream and search are two different methods of API, hence 1 token on whole will be utilized). The team had to ensure that 1 token is being used effectively and to its full extent. The developers had to ensure that rate limit is not reached or when rate limit is reached the project will shift to a different token. Hence the project needed to collect tweets continuously. Building a framework in which all these tokens will be utilized and monitored effectively was one of the challenges.
- Choice of a map for the selection of location during the creation of a project was also a hindrance. The client had left us to select the map of our choice. Choosing an API which will not only be free but will also allow to draw on the map and give longitude, latitude information within acceptable accuracy was the problem.
- The network graph component of the visualization part was a big challenge. The code was provided by the client but had to make some changes in it in order to meet the client’s requirement and be compatible with our application. The graph code was written in R but our application is being run on django. The R code needed somewhat heavier server specifications for smoother user experience and stability.
The developers needed to ensure that user experience in the graph component remained somewhat consistent with the other components. - The sentiment analysis and bot detection code were to be developed by us from scratch. For the sentiment analysis there was the problem of tweets being collected in Arabic, Turkish or Persian depending on the language chosen at the creation of project. Developing a sentiment
analysis and bot detection code which will satisfy the client was the challenge. All codes must use UTF-8 to support these languages. The sentiment analysis code must support all of the given languages. For the bot detection the user information must be stored so that if a user appears a second time the previously stored probability will be fetched instead of calculating new. - Not only the user experience but the server also started to slow down when several projects were started simultaneously. The server’s memory and CPU utilization became almost full. Building a solution that will keep the load on the server within acceptable range and will also increase user experience was the challenge. Also as the data of a project grows so does the CSV, JSON file of the project. Simple file download configuration produced low download speed without resume capability. The Apache server was somewhat configured to allow users to download large files with maximum speed and resume capability.
SOLUTION
While coping up with the challenges, the staff always kept the client’s satisfaction as their number one priority followed by the stability, performance and robustness of the application. Continuous cooperation from the client’s side and diligence of our staff were the key factors in coming up with the solution. Upon analyzing the expected traffic and considering client’s monetary benefits the team proposed using Google Compute Engine with 2 CPUs and 8 Gb Memory. A Django application was considered to be more effective. The structure of the application can be summarized in the following block diagram:
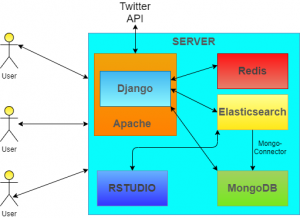
-
Elasticsearch
MongoDB has its limitations when it comes to full text search. Also when dealing with a relatively large data, performing queries on the fly to get the required information for the visualization part is quite slow, hence, impacting the user experience badly. Instead of using a database the team agreed upon using a Search Engine for the application and for this purpose Elasticsearch was chosen. Elasticsearch is one of the most commonly used search engine providing a distributed, multitenant-capable full-text search engine with an HTTP web interface and schema-free JSON documents. MongoDB documents were indexed to Elasticsearch with the help of Mongo-Connector. MongoDB was kept as a backup database because it is relatively more secure than Elasticsearch in terms of storing documents. Owing to the Elasticsearch’s fast searching algorithms, getting the required information for visualizing the project on the fly became relatively faster and hence the user experience was also drastically improved. The django application now indexed the tweets on the Elasticsearch while Mongo-Connector stored them to MongoDB. The crashing of the database was also solved due to this approach. A cron job was also created on the server in case if crash or other discrepancy occurred; the server, MongoDB and Elasticsearch will restart and resume their normal operation. Elasticsearch was only used to index tweets and user accounts information. The other basic needs of the application were carried out with MongoDB having two nodes (additional node served as a backup).
-
Round Robin Token Rotation
In order to utilize the tokens to their maximum potential, a round robin technique was implemented. Whenever a token encounters an error or rate limiting occurs, it logs the error onto the database so that the admin can monitor it and the project shifts to a different token. The technique was optimally implemented so that the project does not frequently shift tokens but does so only when error occurs. Rate limiting was also controlled by controlling the speed at which the data from twitter is being processed. A token getting its limit reached frequently or being connected/disconnected frequently will eventually get banned from Twitter. A token without any errors will shift to a new project after a period of 1 day. The rate limiting almost never occurred during the streaming of the project and thus securing the continuity of the project and the safety of tokens. A framework was successfully built in which all the tokens were effectively utilized and the project streamed tweets continuously. 1 token will be used during the start of the project but after the search method is finished, the same token could also be used in another project. Even after 3 months of completion of Tweet Miner no token is banned from twitter and almost none has reached its limit during this time.
-
Leaflet Maps
Selecting a map which will give longitude and latitude information on drawing a polygon to specify the location bounds within acceptable accuracy was the problem. Freeware along with the ability to draw on a map was the key choice factor. Leaflet maps were chosen for this purpose. Leaflet is a light weight open source JS library and also has mobile friendly interactive maps. It has libraries which allow getting long/lat information by drawing a shape on the map within suitable accuracy. These maps have the qualities of performance, simplicity and usability in them. By using these maps long/lat coordinates were obtained which were then used to get tweets within a specific bound. The tweets’ locations were then cross referenced with the original bounds given by the Leaflet map to see whether the accuracy is acceptable or not. All of the tweets remained inside the polygon and hence satisfying the client’s needs.
-
R and RStudio Server
The network graph component was a github public repository. The code had some issues with it in regards to usability and stability. The code was purely written in R. RStudio Server was added on the cloud due to which the load on the server further increased. The code was improved in several areas in order to increase the stability and user experience. Even after increasing several parts of the code, the usability of the network component was still lacking. Due to the efficiency limitations of R language, the scaling parameters compelled us to change the hardware specifications of the cloud server to 4 CPUs and 16 GB of memory. This improved the performance of the network component by a large factor. Increasing the specification also eradicated the problem of maximum utilization of memory and CPU. The tweaks which were made in the component were kept which also increased the robustness and performance of the network graph. By using HTML techniques the R code was incorporated onto the application thus making it compatible with django.
-
Arabic, Turkish and Persian Sentiment Analysis
Since the project supported collecting tweets in English, Arabic, Turkish or Persian; the sentiment analysis for the non English part was to be developed. VaderSentiment was used for English tweets but for the other languages, the team had to construct lexicon, stopwords, negations and emojis (positive and negative) list with the client’s collaboration. The list was carefully filtered and constructed so that effective sentiment analysis would be done. All of the backend code supported UTF-8 so that non English language tweets can be handled. Without the cooperation of the client, the lists would not have been made in an efficacious manner The developing of bot detection code was rather simple because of our previous client’s work.
-
Optimizing configurations & Stress Testing
The server’s specifications had already been reconfigured for solving the problem of network graph’s performance. For further increasing the server’s
performance and decreasing the load on it, several different tweaks had to be applied. Redis cache server was installed to make use of its cache ability. Mod_pagespeed was added which increased page loading times by minifying CSS, HTML, JS. Mod_xsendfile was also added to allow download of large files with maximum speed and resume capability. The security and stability of every service running on the cloud was checked and tested thoroughly. For rigorous testing, the team lead had made the decision to offer the client 3 months support. Initially the project was of 40 days but in order to ensure our application’s performance, stability and client’s satisfaction, the additional support was provided. In these months stress testing was done on the server and step by step tweaks were added.
WORKING DEMONSTRATION
RESULT
The completed application had met all the requirements of performance, security and robustness. The client was well satisfied, hence, the staff had accomplished the main goal of every project in our organization i.e. client satisfaction. They even gave their future projects to us owing to the service and satisfaction they received from our end. Thus, a long term friendly relationship was formed between us and we hope to continue this relationship till the foreseeable future. They were generous to give remarks like:
Excellent and reliable team to work with. Very effective and knowledgeable of what we wanted and communicate well to keep the project smooth and hassle-free. We would recommend them.

